

1. Introduction
When you source fuel pumps for resale or OEM integration, the headline number on a datasheet is rarely the whole story. A pump advertised at “340 LPH” can mean very different things depending on the pressure it was tested at, the voltage applied to it, and the fuel used during the test. For importers, distributors, and private-label purchasing leads, the flow curve is the single most useful document a supplier can provide, and it is also the most commonly misread.
This guide explains what a fuel pump flow curve shows, how to convert between LPH and GPH and between PSI and bar, and how to compare two suppliers on equal terms. If your specification calls for a 60 psi fuel pump, the curve, not the marketing figure, tells you whether a candidate actually delivers the flow you need at that pressure.
KOLA MOTOR manufactures brushless, high-performance, and low-pressure fuel pumps for global B2B distributors and OEMs. The technical principles below apply across our range and across the wider market, so you can validate any supplier’s claims the same way. We advise every buyer to confirm the final specification against the supplier’s written datasheet before committing to production volume.
2. What is a Fuel Pump Flow Curve
A flow curve is a two-axis graph that plots a pump’s delivered flow rate against the back-pressure it must work against. As system pressure rises, flow falls. Every positive-displacement pump and most centrifugal fuel pumps follow this declining relationship. The curve is the pump’s performance fingerprint: it shows the trade-off between how much fuel moves and how hard the pump has to push it.
Reading only the free-flow, or zero-pressure, number hides the part of the curve that matters most for an engine under load. That is why serious high-performance fuel pumps are evaluated at multiple pressure points rather than just at the open end of a hose.
3. How to Read a Fuel Pump Flow Curve
Flow Axis and Pressure Axis
The horizontal axis is pressure, shown in PSI or bar. The vertical axis is flow, shown in LPH or GPH. To read the curve, pick a pressure value along the bottom, move straight up to the line, then read across to the flow value. That intersection is the flow the pump delivers at that pressure under the stated test conditions. When comparing pumps, always read at the same pressure point.
Test Voltage
Electric fuel pumps are sensitive to supply voltage. A curve drawn at 13.5 V, which is typical running automotive voltage, will sit above a curve drawn at 12 V. The voltage must be stated, because a pump that looks strong at 14 V may fall short at 12 V in a real vehicle or at a lower battery state. Always note the voltage before you trust the line.
Test Fluid and Temperature
Viscosity changes with both fluid type and temperature. Gasoline, E85, diesel, and methanol all behave differently, and warmer fuel is thinner than cold fuel. A curve run on gasoline at 20°C does not automatically apply to E85 at 60°C. The test fluid and temperature must appear on the sheet, or the curve is not safely transferable to your application.
Free-Flow Point
The free-flow point is where the curve meets zero pressure, the maximum flow with no restriction. It is useful for quick diagnostics and for spotting a clogged inlet, but it is the least representative number for sizing a pump that must hold pressure against a regulator and injectors. Treat it as a ceiling, not as working capacity.
4. Unit Conversion
Suppliers publish curves in different units, so normalization is the first real comparison step. Convert every curve to the same axes before you place them side by side. Use the conversions below.
| Quantity | Convert | Formula |
|---|---|---|
| LPH to GPH | liters/hour to US gallons/hour | GPH = LPH × 0.2642 |
| GPH to LPH | US gallons/hour to liters/hour | LPH = GPH × 3.785 |
| PSI to bar | pounds per square inch to bar | bar = PSI × 0.06895 |
| bar to PSI | bar to pounds per square inch | PSI = bar × 14.504 |
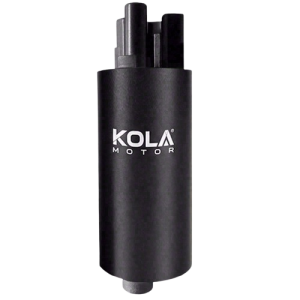
For a concrete example, our 340 LPH brushless in-tank fuel pump rated at 340 LPH equals about 90 GPH, and a 60 PSI target equals roughly 4.14 bar. Always convert before you compare so that both curves share the same axes and the same language.
5. How to Compare Two Pumps Using Flow Curves: 60 PSI Fuel Pump Example
Suppose you must select a 60 psi fuel pump for an application that needs at least 200 LPH, about 53 GPH, at the rail. Supplier A shows 255 LPH free flow. Supplier B shows 220 LPH free flow. On free flow alone, Supplier A wins. But read the curves at 60 PSI, or 4.14 bar: Supplier A may deliver only 170 LPH at pressure, while Supplier B delivers 210 LPH. At the operating point that actually matters, Supplier B is the correct choice.
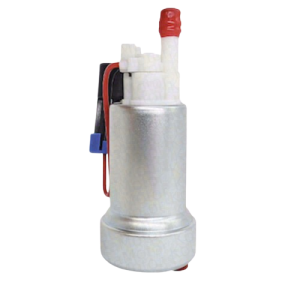
This is where product selection becomes concrete. A high-flow part such as the F90000285 525 LPH E85 high-performance fuel pump is built to retain strong flow deep into the pressure range, while an external inline option such as the Bosch 044-type inline fuel pump serves return-style and external-mount layouts. Compare each at your exact target pressure, not at the open hose.
Build a simple comparison table from the two curves at matching voltage and fluid: flow at 30 PSI, 45 PSI, 60 PSI, and 75 PSI. The pump that holds the highest flow across your working band, not the highest free flow, is the safer purchase for your customers.
6. Common Misreadings of Flow Curves
Comparing Free Flow Instead of Flow at Pressure
The most frequent error is ranking pumps by the zero-pressure number. Free flow ignores the regulator and injector back-pressure your engine actually imposes, so it overstates real-world capacity and leads buyers to undersize the pump for the application.
Mixing Different Test Voltages
Overlaying a 14 V curve from one supplier with a 12 V curve from another makes the higher-voltage pump look better than it will perform in the field. Normalize voltage first, then compare. A half-volt difference can shift the line more than buyers expect.
Ignoring Test Fluid Differences
One curve on gasoline and the other on E85 is not a fair comparison. E85’s different viscosity and density shift the line downward or upward depending on conditions. Always align the test fluid, or ask each of your fuel pump suppliers for the curve on the exact fuel your application uses.
7. What to Request From Fuel Pump Suppliers
Curves at the Declared Voltage
Ask for the flow curve at the exact voltage your system runs, commonly 12 V or 13.5 V. A curve only at 14 V hides the drop you will see at lower supply voltage, and that drop is exactly when a marginal pump fails to hold pressure.
Multiple Pressure Points
Request flow values at several pressures across your operating band, for example 30, 45, 60, and 75 PSI, rather than a single headline figure. More points let you interpolate accurately and catch a curve that falls off a cliff between two wide-spaced measurements.
Written Test Conditions
Insist on a written statement of test fluid, temperature, voltage, and measurement method. Defensible specs protect you when a batch underperforms in the field and a customer asks why the pump did not match the catalog claim.
Batch Consistency Data
For private-label and OEM volumes, ask for batch-to-batch flow variation data. A supplier’s curve is only useful if production units stay close to it. Review the full range in our product catalog and request batch reports before you commit to volume.
FAQs
Q: What should buyers consider when choosing a fuel pump rated for 50-60 psi?
A: Look at flow at 50-60 PSI on the curve, confirm the test voltage matches your system, and verify fuel compatibility. The free-flow number alone is not enough to size the pump safely.
Q: How to compare a 60 psi fuel pump rated in LPH with one rated in GPH?
A: Convert both to the same unit first using GPH = LPH × 0.2642, then read flow at the same pressure point on each curve. Only compare like-for-like axes.
Q: Which test voltage should fuel pump suppliers report flow curves at?
A: The voltage your application actually runs, typically 12 V or 13.5 V for automotive and 12 V for many industrial systems. Request the curve at that declared voltage rather than at an idealized higher value.
Q: What does free flow mean on a fuel pump datasheet?
A: Free flow is the maximum flow at zero back-pressure. It is a useful diagnostic but not representative of flow under real regulator and injector pressure, so do not size a pump from it alone.
Validate Your 60 PSI Fuel Pump Specs With Real Flow Curves
Request KOLA MOTOR’s documented flow curves, batch consistency data, and an engineering review for your target pressure and fuel before you commit to volume.
9. Conclusion
A fuel pump flow curve is the honest version of a supplier’s claim. Read it at your real pressure, at your real voltage, and on your real fuel, and you will stop being misled by free-flow headlines. Convert LPH to GPH and PSI to bar so every candidate shares the same axes, then compare flow at the pressure your engine actually runs. Treat the documented curve and batch consistency data as part of the purchase specification, not as optional extras. KOLA MOTOR supports B2B distributors and OEMs with full flow data across our brushless, high-performance, and low-pressure ranges, and we recommend confirming every figure against the written datasheet before you buy.
